Eén platform
voor al uw IT-monitoring
Krijg volledig inzicht in je IT-landschap met PIM+ Monitoring Software, van on-premises systemen en cloudservices tot ketens en endpoints
De keuze van marktleiders in elke sector
Onze IT monitoring oplossingen zorgen voor optimale prestaties bij toonaangevende organisaties in diverse sectoren.

Features
De toekomst van IT-monitoring begint hier


Volledig inzicht
Al uw IT-infrastructuur in één oplossing
Wij combineren de kracht van Azure, Linux, Cisco Meraki, AWS en andere toonaangevende technologieën in één oplossing. Zo heeft u altijd volledig inzicht en controle over uw IT-omgeving.
Onbeperkte Schaalbaarheid
PIM+ groeit moeiteloos mee met uw IT omgeving
0
nodes
Groei zonder Grenzen
PIM+ schaalt onbeperkt met uw IT-omgeving en blijft betrouwbare monitoring leveren tot 50.000+ nodes en verder, ongeacht de grootte van uw infrastructuur.
Schaalbaarheid
Onbeperkt schaalbaar
Of je nu 10 of 10.000 devices monitort, lokaal of verdeeld over meerdere geografische locaties, PIM+ groeit mee met de omvang van je IT-omgeving.
Scripting
Uitbreidbaar door scripting
Met enkele regels PowerShell, JavaScript, of Python code integreer je custom scripts of monitor je third-party API's met PIM+.
Self-hosted
Host PIM+ waar jij wil
Met PIM+ kies je zelf waar je de monitoringomgeving installeert: lokaal op je server of in de cloud.

Nederlandse Support
We staan altijd voor je klaar
Onze Nederlandse consultants en servicedesk staan altijd klaar om je snel en deskundig te helpen met je PIM+ vragen.


Agentless monitoring
Geen client software nodig
Door onze agentless monitoring architectuur krijg je direct inzicht in je infrastructuur zonder extra software of complexe koppelingen.
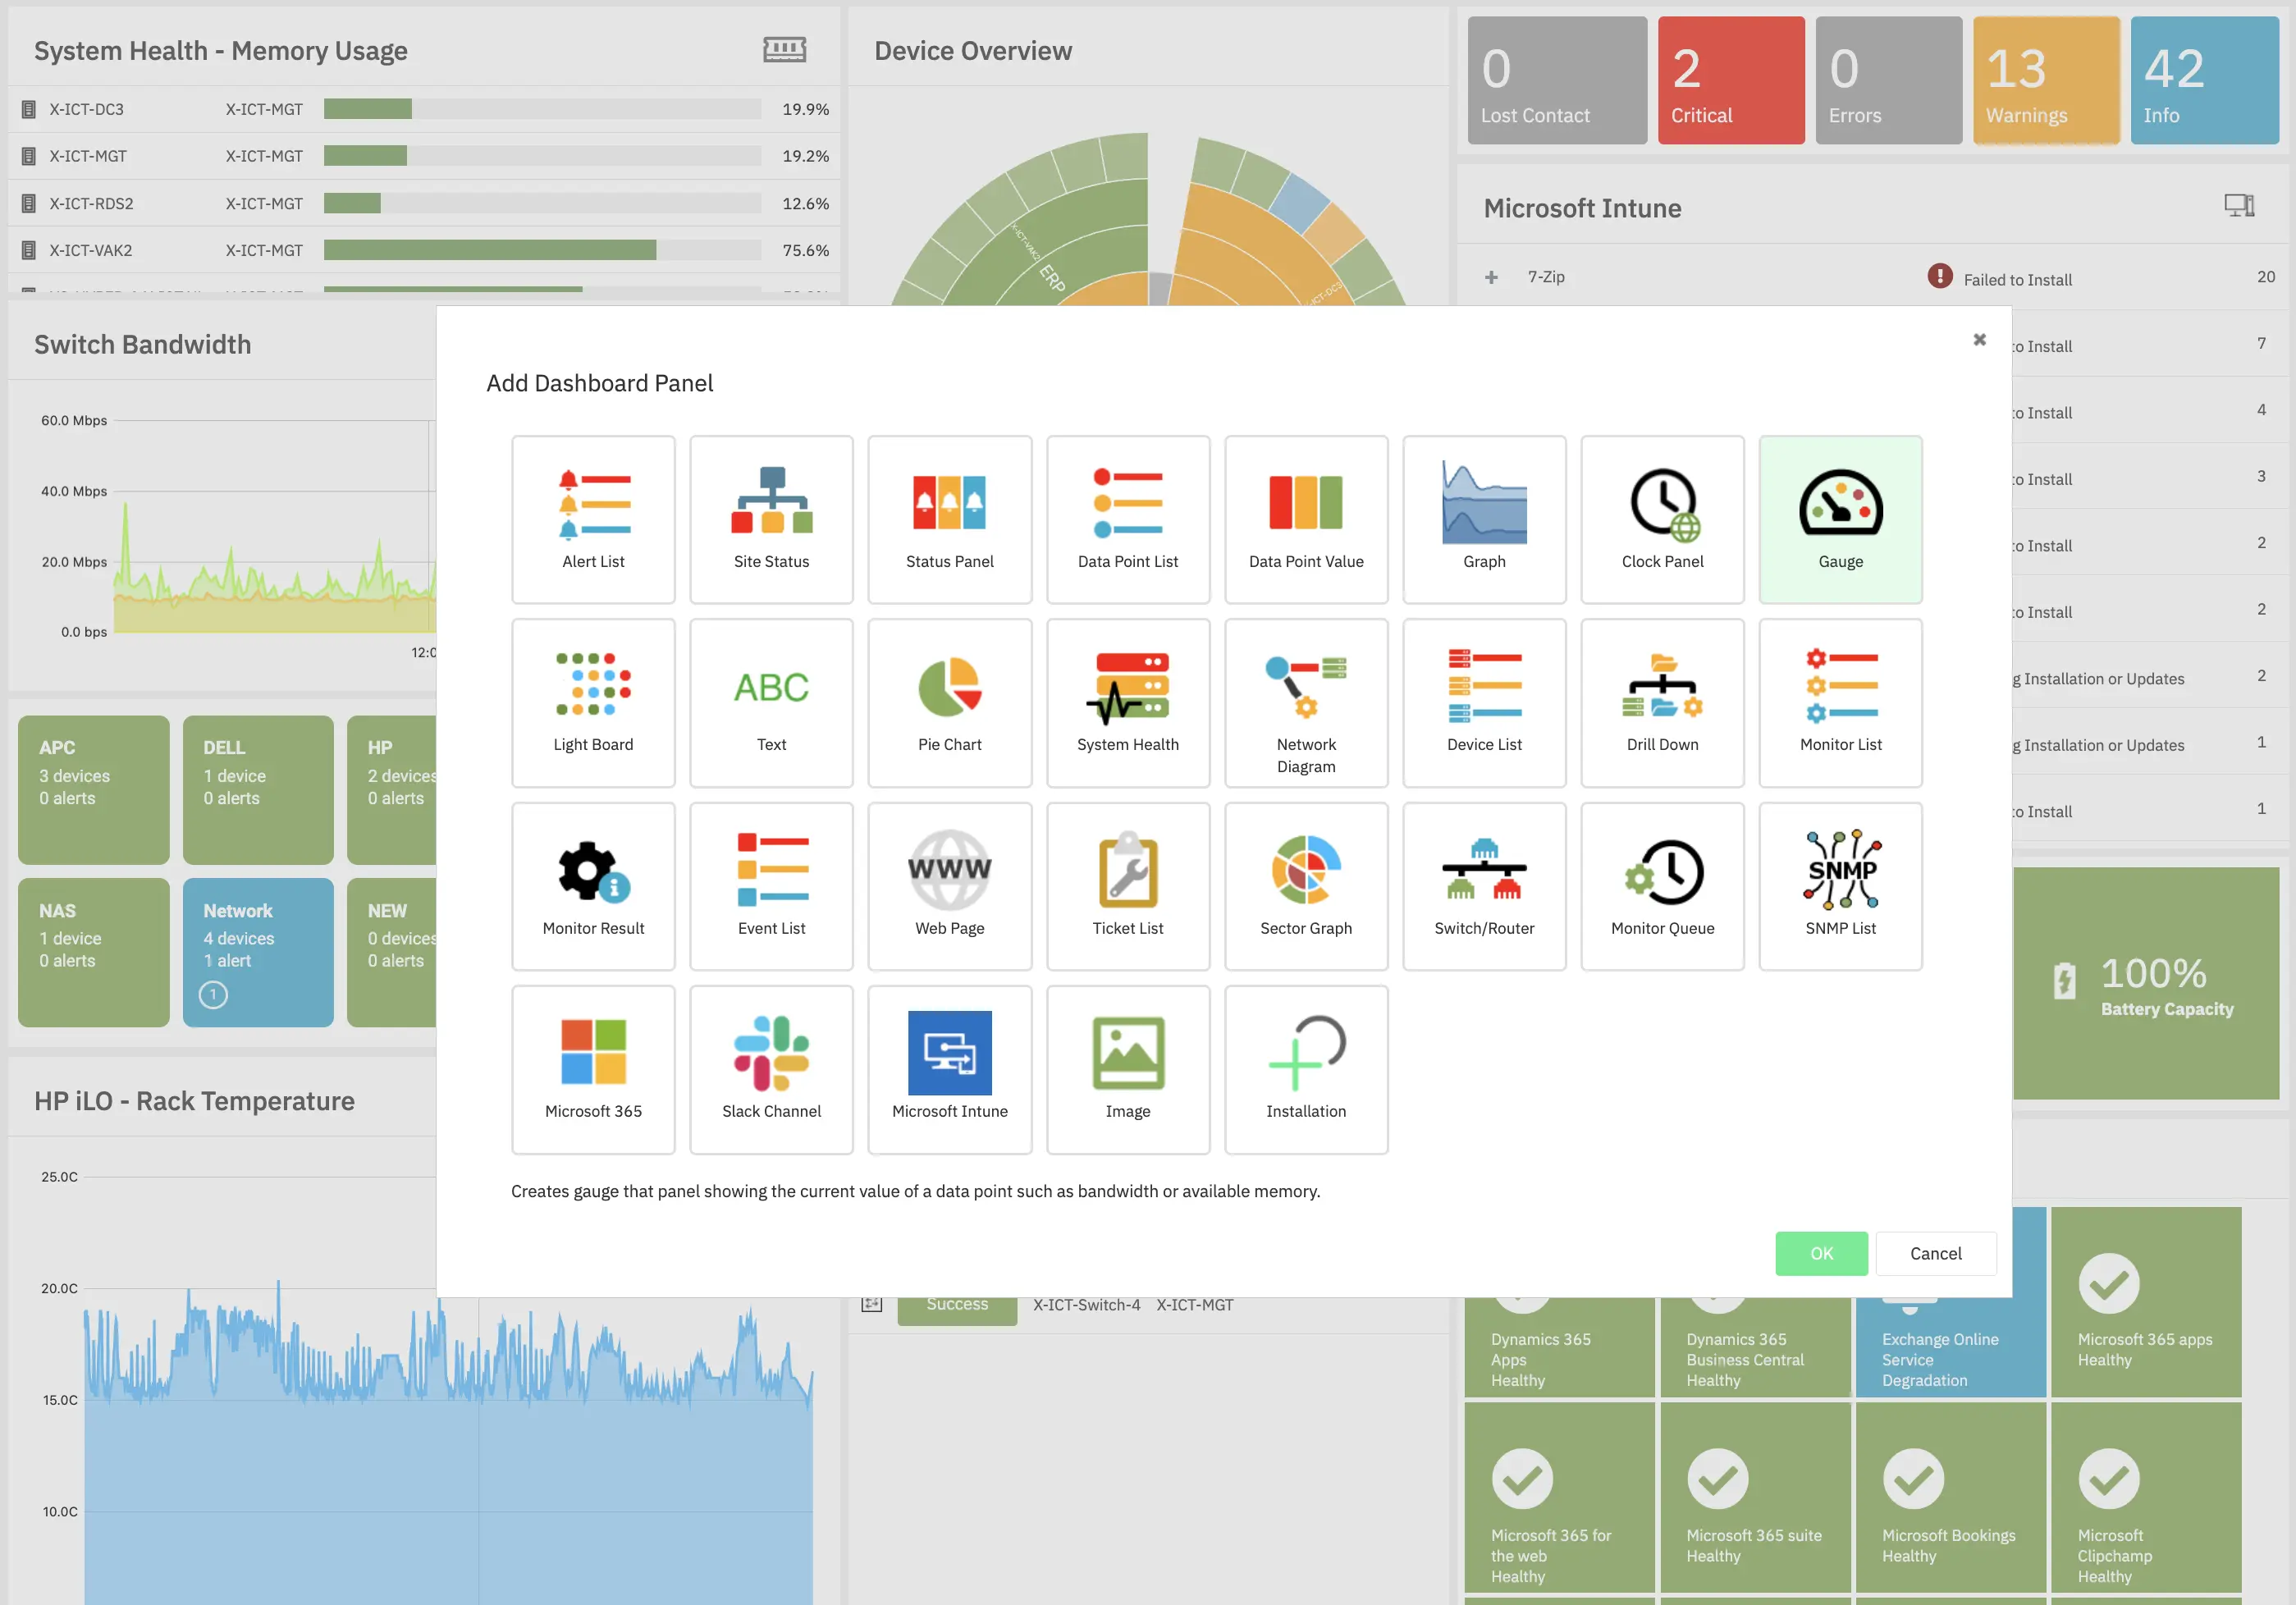
Visualisatie
Dashboards, rapportages en meer
Creëer intuïtieve dashboards in slechts enkele minuten met onze drag & drop dashboard-builder. Klik, sleep en bouw overzichtelijke visualisaties die je direct inzicht geven in je IT-omgeving.
Alles in beeld met onze monitoring
Met onze uitgebreide monitoringoplossingen krijgt u volledig inzicht in uw IT-infrastructuur. Van servers en netwerken tot datacenters en industriële systemen, PIM+ houdt alles voor u in de gaten.
- Server Monitoring
- Houd je servers betrouwbaar en performant. Monitor mailservers, webservers, databaseservers, virtuele servers, en meer om proactief problemen te voorkomen. Lees meer
- Netwerk Monitoring
- Krijg real-time inzicht in netwerkprestaties en apparaatstatussen. Monitor verkeer, apparaten, applicaties en stel alarmen in om netwerkproblemen snel op te lossen. Lees meer
- Clouddiensten Monitoring
- Monitor je cloud-infrastructuur en services, inclusief platforms zoals Azure en AWS. Zorg voor continuïteit van websites, applicaties en cloudomgevingen. Lees meer
- SNMP Monitoring
- Monitor netwerkapparatuur zoals switches, routers en firewalls via SNMP. Krijg inzicht in real-time prestaties en apparaatstatussen. Lees meer
- Datacenter Monitoring
- Beheer de volledige omgeving van je datacenters. Monitor stroomvoorziening, koeling, hardwareprestaties, en detecteer knelpunten voordat deze impact hebben. Lees meer
- Industriële IT Monitoring
- Combineer IT en OT monitoring met ondersteuning voor OPC UA, Modbus, MQTT, en industriële gateways. Zorg voor continuïteit en efficiëntie in industriële omgevingen. Lees meer
Samen succesvol
Dit zeggen onze klanten over ons:
Schrijf je in voor onze nieuwsbrief
Blijf op de hoogte van het meest actuele X-ICT monitoringsnieuws – voor zowel IoT als IT!
- Geen spam
- Wij respecteren je privacy. Verwacht alleen relevante en waardevolle updates, zonder ongewenste berichten.